A Glossary for Life Among the Agents

Your workplace will never be the same. Skills, workflows, and delivery methods are being permanently augmented.

The tools get better. Output accelerates. In many cases, quality dips slightly — but often not enough to matter.

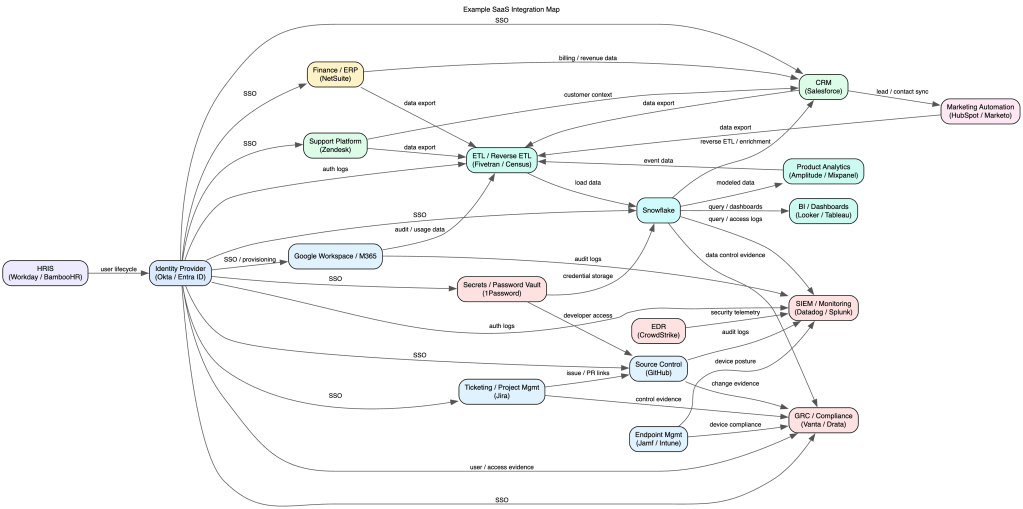
The collective graph of knowledge grows denser and more connected every day. I don’t think AGI, in the 1990s sci-fi sense, is ever arriving. But we are absolutely building something else: an epic hybrid neural system composed of humans, models, tools, and feedback loops.

I’m just one node in that system. Happy to contribute.

After spending significant time with frontier models and the emerging ecosystem around them, I’ve started noticing recurring patterns, behaviors, and phenomena that deserve names of their own. Here are a few phrases I’d propose for the new AI era.

(In no particular order.)

AI-guilt

The feeling of hesitancy to ask colleagues to review presentation decks, code or pull requests, driven by the significant boost in one’s own productivity from using AI agents and tools.

LLM-zen

(pronounced ELM-zen)

Achieving a state of flow in a work setup that leverages multiple agents, models, and providers.

vibe-scent

The passive signal a technical person gives off about their AI tooling fluency — detectable in how they talk, work, or describe their stack, without them ever stating it directly.

hype-climb

The feeling of wonderment, that with all the AI developments and cool tech, that it only gets better or more useful from here on out.

token-chasm

The wide disparity within an organization, where a small group of individuals uses and consumes orders of magnitudes more tokens then the remaining segments of company personnel.

stop-slop

The collective desire to require (by regulation or industry pressure) a ‘SLOP‘ button on any item of posted social media content, so that the human race can feel better about contributing to the identification and avoidance of bad AI slop. But also knowing (unfortunately) that this itself is a feedback mechanism which could help improve AI to make SLOP that is more difficult to identify.

cubicle-AI

AI tools or services trained and configured within a large corporation which vastly undercut the the bigger capabilities of the underlying LLM due to corporate governance and guardrails. ex. “That is a great prompt, and and answer requires detailed expertise and subject matter knowledge from within the firm.”

gen-check

The etiquette of checking and modifying generated content before distributing to colleagues. Not necessarily a heavy QA on a deliverable or final product.

token-envy

The anxiety of not burning through as many tokens as your colleagues, even when raw consumption doesn’t actually translate to more or better output — keeping up with the Joneses, but for prompt spend.

stack-thrash

When doubt about your current toolkit and envy of what others might be running leads to constant tinkering, tool-hopping, and stack-tweaking — all motion, no velocity. Could be used in contexts outside of AI.
Map Your Data Integrations, Or You Don’t Understand Your Risk

It’s 3am. Do you know, exactly, where your data is?

Which vendors receive or touch your data?

What type of data each vendor is involved with?

Startups and software move fast.  Pretty soon the SaaS and vendor integrations pile up.  Security and Privacy implications are real but invisible, versus the actual connections over which your company’s data is flowing.

Thesis: you need to maintain a living map of your SaaS and vendor integrations, otherwise you don’t actually understand your data tenancy or security.

Ask yourself, at your company do you know who owns the list of all vendors and data flows?  “I think someone knows…”  “We could pull that together…”  “It exists somewhere…”  You’re already behind.

If you’re in a regulated industry or in a high expectations contractual space with customers, not having this data integration map is a risky way to operate.

  • Security
    • Data movements
    • Blast radius
  • Privacy and Data Governance
    • Where is PII/PHI flowing?
    • Subprocessors (approval and reviews)
    • Data retention + deletion obligations
  • Compliance & Customer Trust
    • SOC2, HITRUST, HIPAA, PCI, etc.
    • Enterprise security questionnaire: “List all your subprocessors”

Without the data integrations map, you’re running a structural risk not just an operational inconvenience.

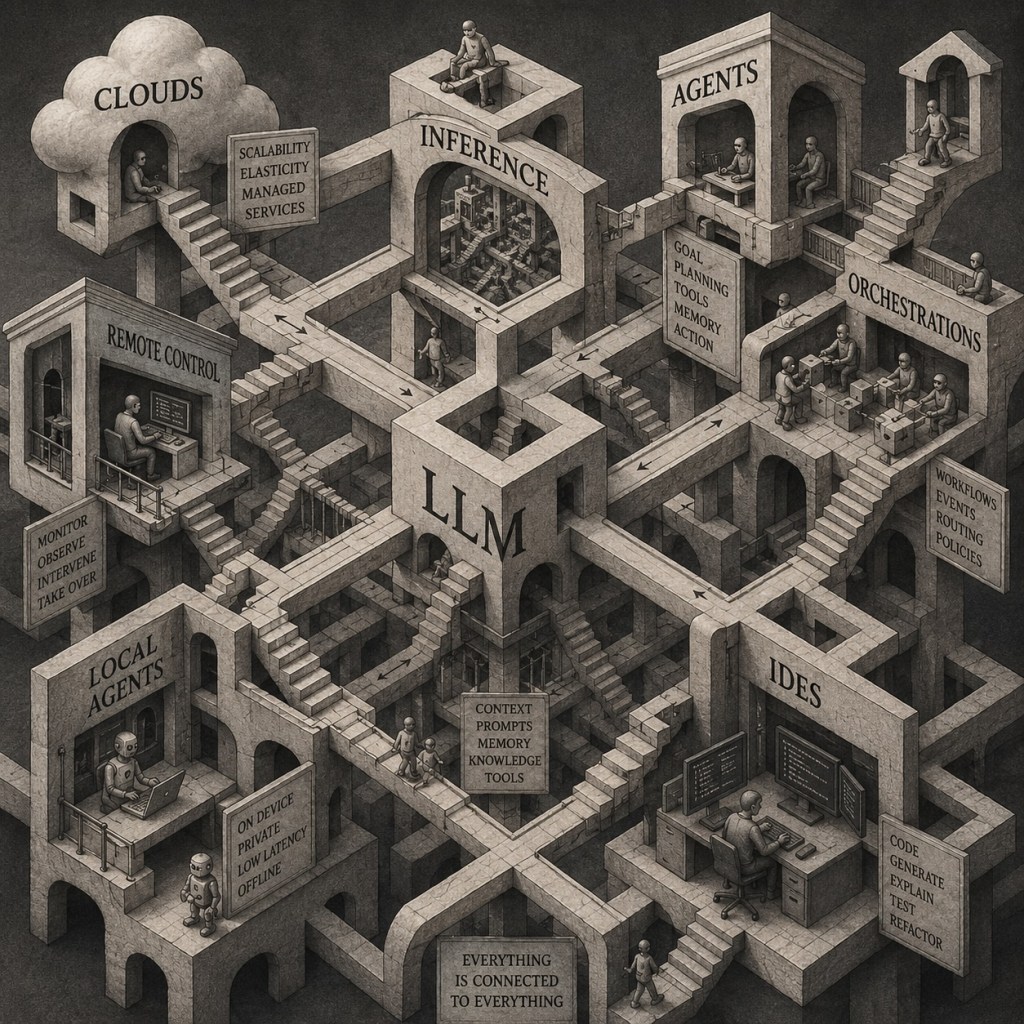
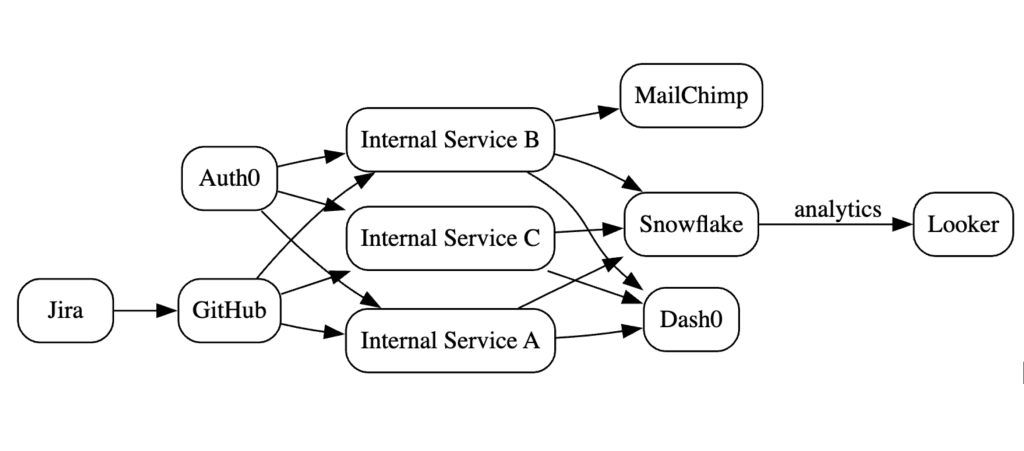
Data Integrations Graph (DIG)

Yes, ‘graph‘ as in the discrete mathematical sense.  A visualization with nodes and edges. An xlsx, google-sheet, or table simply isn’t going to cut it.

  • Nodes: your systems, vendors, SaaS tools, data partners
  • Edges: direct connections and data flows between Nodes

And a clarification: Data Flows vs. Data Integrations (and why this matters). The DIG can extend the idea of a formal Data Flow Diagram (DFD) beyond your own systems and services, to include every external system your data might touch. This is where most companies lose visibility.

Codify

As mentioned above, a spreadsheet can’t convey the graph.  Instead use a lightweight syntax like Mermaid, graphviz, or D2.  (There are many many many online renderers for graphviz.  And if you have a high security environment, you’ll want to download and run graphviz within your network to mitigate the chance of publicly leaking the graph.)  See basic and complex examples in graphviz syntax.  (Generated pics below.)

The graph may become complex visually. Rather it’s the code/syntax definition which is meant to be referenced (i.e. control-F for all mentions of a node) and not for the sole purpose of visualization generation. (But visualizations _are_ fun.)

Living Document

This is not just a “generate once” and now we’re done.  Put the graph under source control, assign an owner, and involve processes and teams to ensure it stays up to date.

  • Reviews: annual or quarterly for network or inventory
  • Incident Response: understand blast radius quickly
  • Shadow IT discovery: cross-check against other inventories or reality
  • Vendor / SaaS acquisitions, reviews, and offboarding
  • Threat Modeling
  • Data Flows: use the graph to inform the flow diagram

CTA

Start small (pick 5-10 systems), map the integrations, put it in source control, and integrate into regular company processes.

You don’t need a perfect graph. You need a living one.

The companies that win on trust aren’t the ones with the most policies — they’re the ones that actually understand their systems.